Get started with WebPros Dashboard
Overview
The WebPros Dashboard interface contains several menus and options that allow you to configure and monitor your websites and servers.
If you do not already have a WebPros Dashboard account, you can create one at: webpros.com/dashboard.
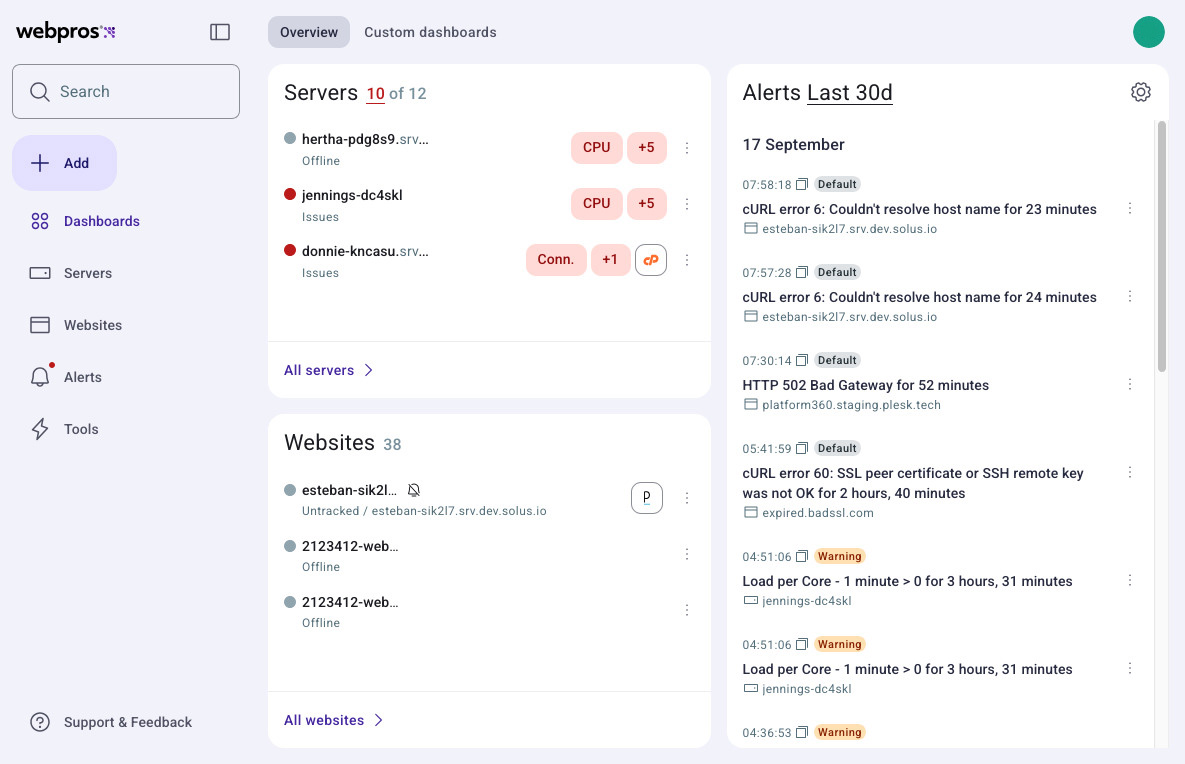
WebPros Dashboard consists of the following sections:
Dashboards
The Dashboards menu displays views for your servers, websites, and recent alerts. It is also the default menu when you log in.
- The Servers section shows you a list of all the servers you have added and their status.
- The Websites section shows you a list of all the websites you have added and their status.
- The Alerts section shows you a list of recent alerts.
- To configure the time and date for which alerts to display, click the date link. By default, this setting is
Last 30d. - You can click the gear (
 ) icon to adjust your alert settings.
- To configure the time and date for which alerts to display, click the date link. By default, this setting is
If you want to create a customized dashboard, read our add dashboard documentation.
Servers
The Servers view displays a list of all your servers and their current status. You can use the Filters menu to customize the view:
| Filter | Description |
|---|---|
| Offline | Servers whose agents have not responded. |
| Issues | Servers whose agents have recently reported a problem. |
| cPanel | Your cPanel & WHM servers. |
| Plesk | Your Plesk servers. |
| Muted | Servers that you have disabled alerting. |
You can also sort the Server view via the Order by menu. You can order your servers by Issues, Name, or Date added.
You can add your servers to WebPros Dashboard to monitor their online status and get alerts when they are offline. To read more about adding your servers, read our Add or remove a server documentation.
Websites
The Websites view displays a list of all your monitored websites and their status. You can use the Filters menu to customize the view:
| Filter | Description |
|---|---|
| Server | Display websites that are tagged as part of a server that’s listed in Dashboard. |
| Issues | Display websites where the Dashboard has recently detected a problem. |
| Muted | Display websites for which you have paused alerts. |
You can also sort the Websites view via the Order by menu. You can order your servers by Issues, Name, Date added, or Load time.
You can add your websites to WebPros Dashboard to monitor their online status and get alerts when they are offline. To read more about adding your websites, read our Add or remove a website documentation.
Alerts
The Alerts menu displays the alerts for your servers and websites. You can configure when to receive alerts and to whom the system should delivery the notifications. This menu contains three tabs:
| Tab | Description |
|---|---|
| History | View a list of alerts your WebPros Dashboard has received from your websites and servers. |
| Alerts | Configure when your WebPros Dashboard should send alerts. |
| Contacts | Manage contact details and configure how your WebPros Dashboard should notify them. |
Tools
The Tools menu displays the Blocklist, Status Pages, and Full Site Check features.
| Feature | Description |
|---|---|
| Blocklist | The Blocklist interface displays notifications if any of your IP addresses appear on a spam list. You can also review and search the spam list providers that Dashboard queries. |
| Status Pages | The Status Page interface allows you to create a publicly accessible Dashboard website and server status pages. For more information about creating a status page, read our Pages documentation. |
| Full Site Check | The Full Site Check interface allows you to run a test on your website that scans for errors and problems. Dashboard generates a report that helps you identify and resolve issues found in your website’s content. |